Multi-Batch Analysis
This functionality allows analyzing the relation between Batches on the transactions (documents) level.
The user can save data used in the graph as a xlsx file. There are three sets of underlying data directly from the trace graph:
- Batches with attributes
- Transactions (documents) for each Batch
- Links between Batches
And one set of Derived data:
- (Direct → Indirect Batch) - Transactions. For the Batch (direct) are specified all batches affecting it (indirect) with all transactions for the direct Batch.
Using this data, users can, using pivot tables prepared by themselves, get information like:
- Are there any Batches affected by a raw material Batch with Country of Origin = Pakistan for selected delivery notes?
- Display all delivery notes affected by batches from selected GRPO.
In BT360 it is possible to:
-
Filter Batches associated with the selected transaction - Document Type → Doc entry and switching to Trace Analysis on the list of Batches
-
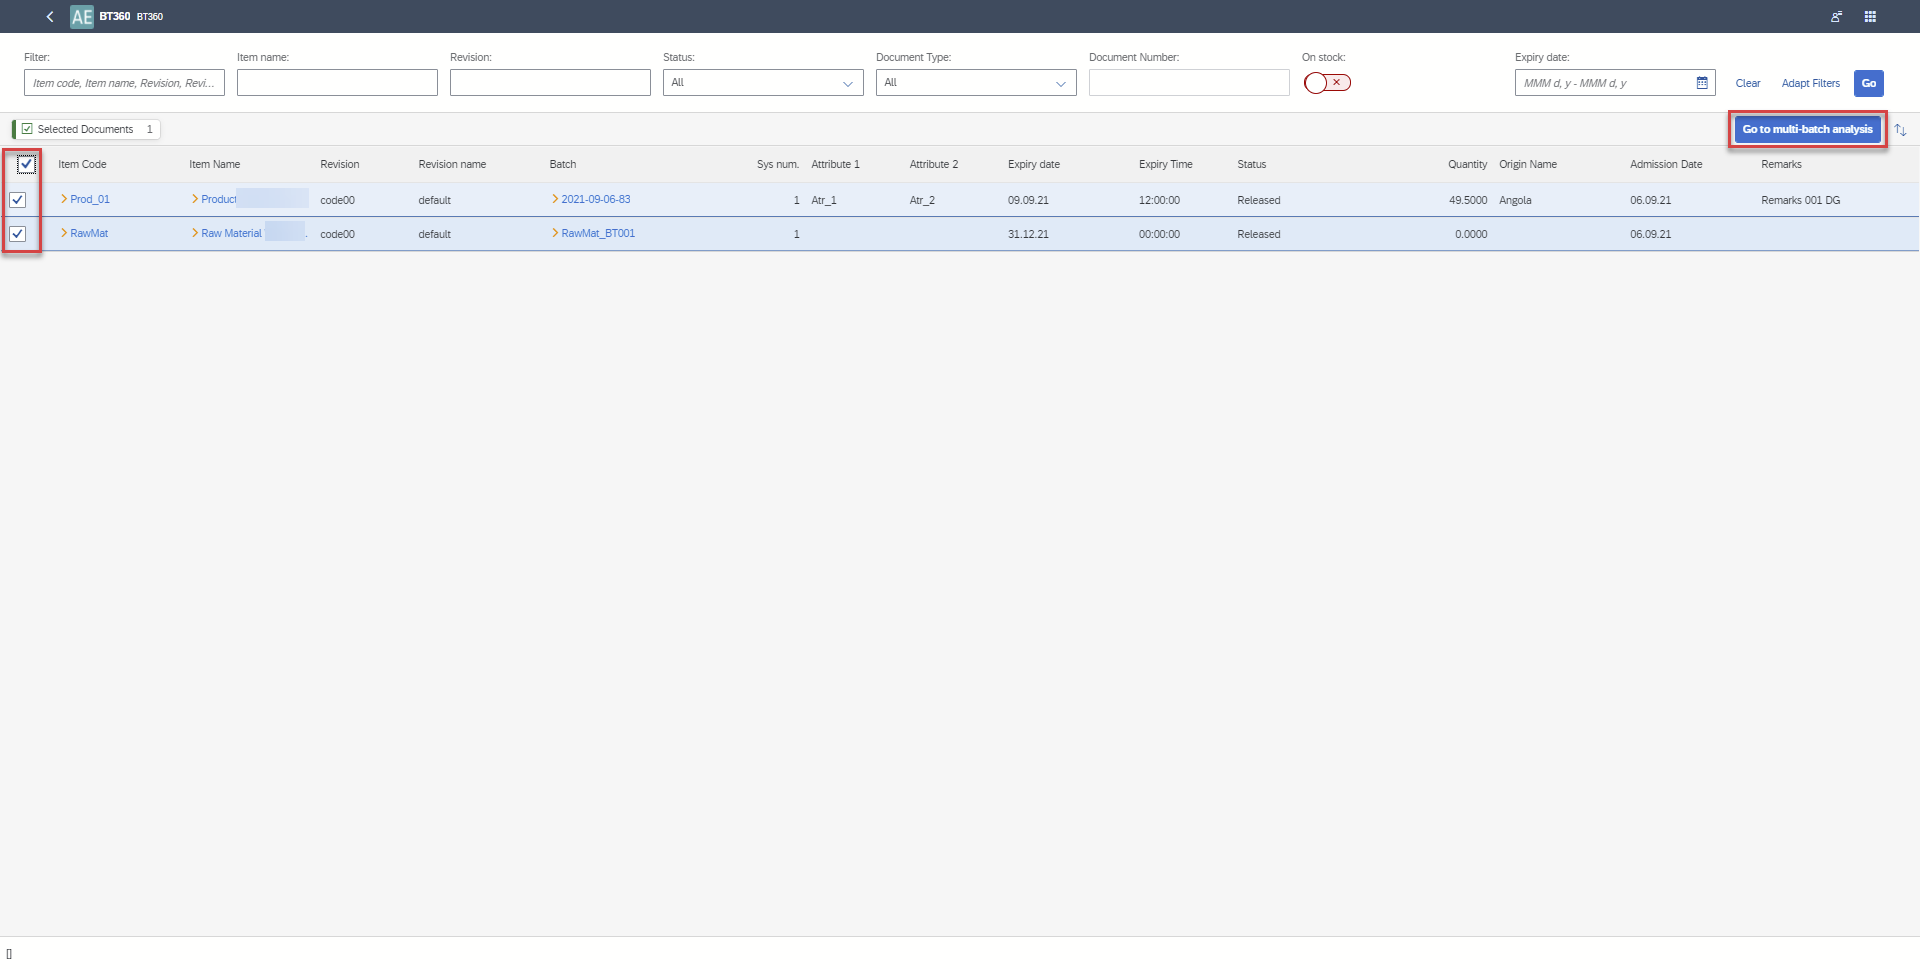
Display Transaction Analysis for selected Batches with the following information: multi batches graph
a. grid of batches with attributes
b. grid of transactions
c. grid of links
d. grid of derived data. -
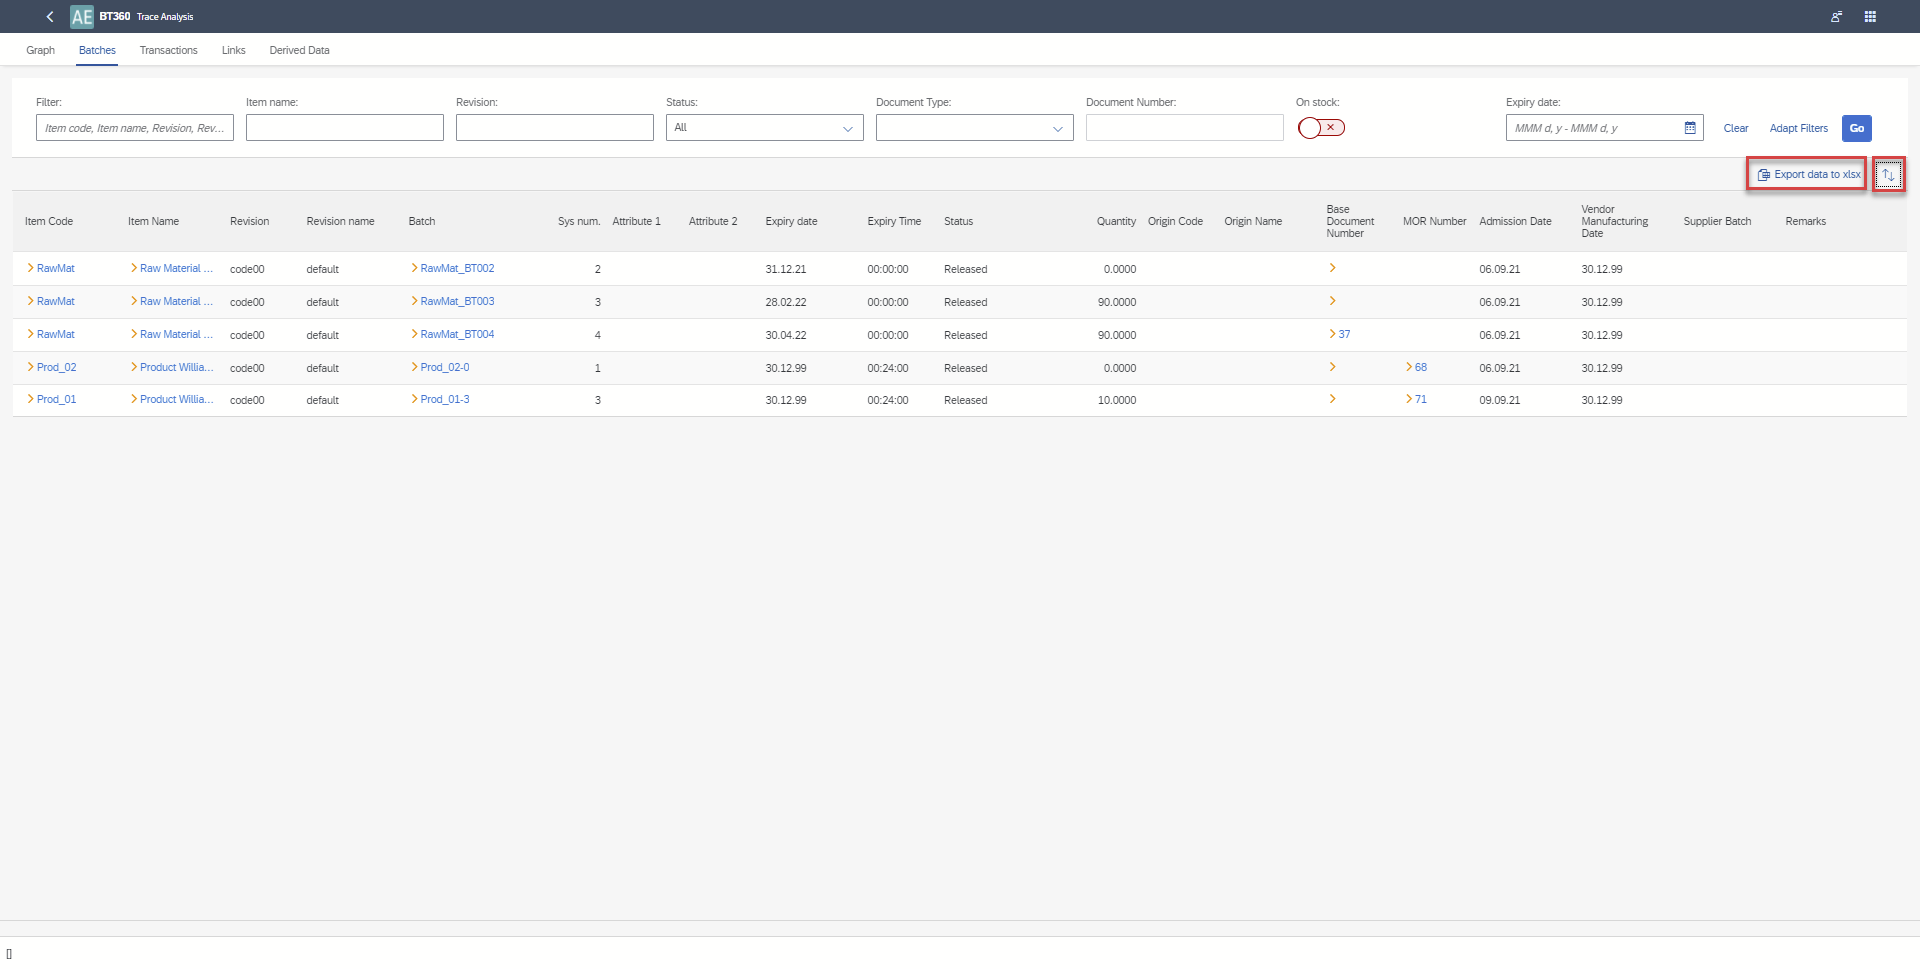
Export data from these 4 grids to an xlsx file (each to a separate tab).
-
Selection of a Batch on multiple Batches graph will redirect the user to the functionality of a single batches graph.
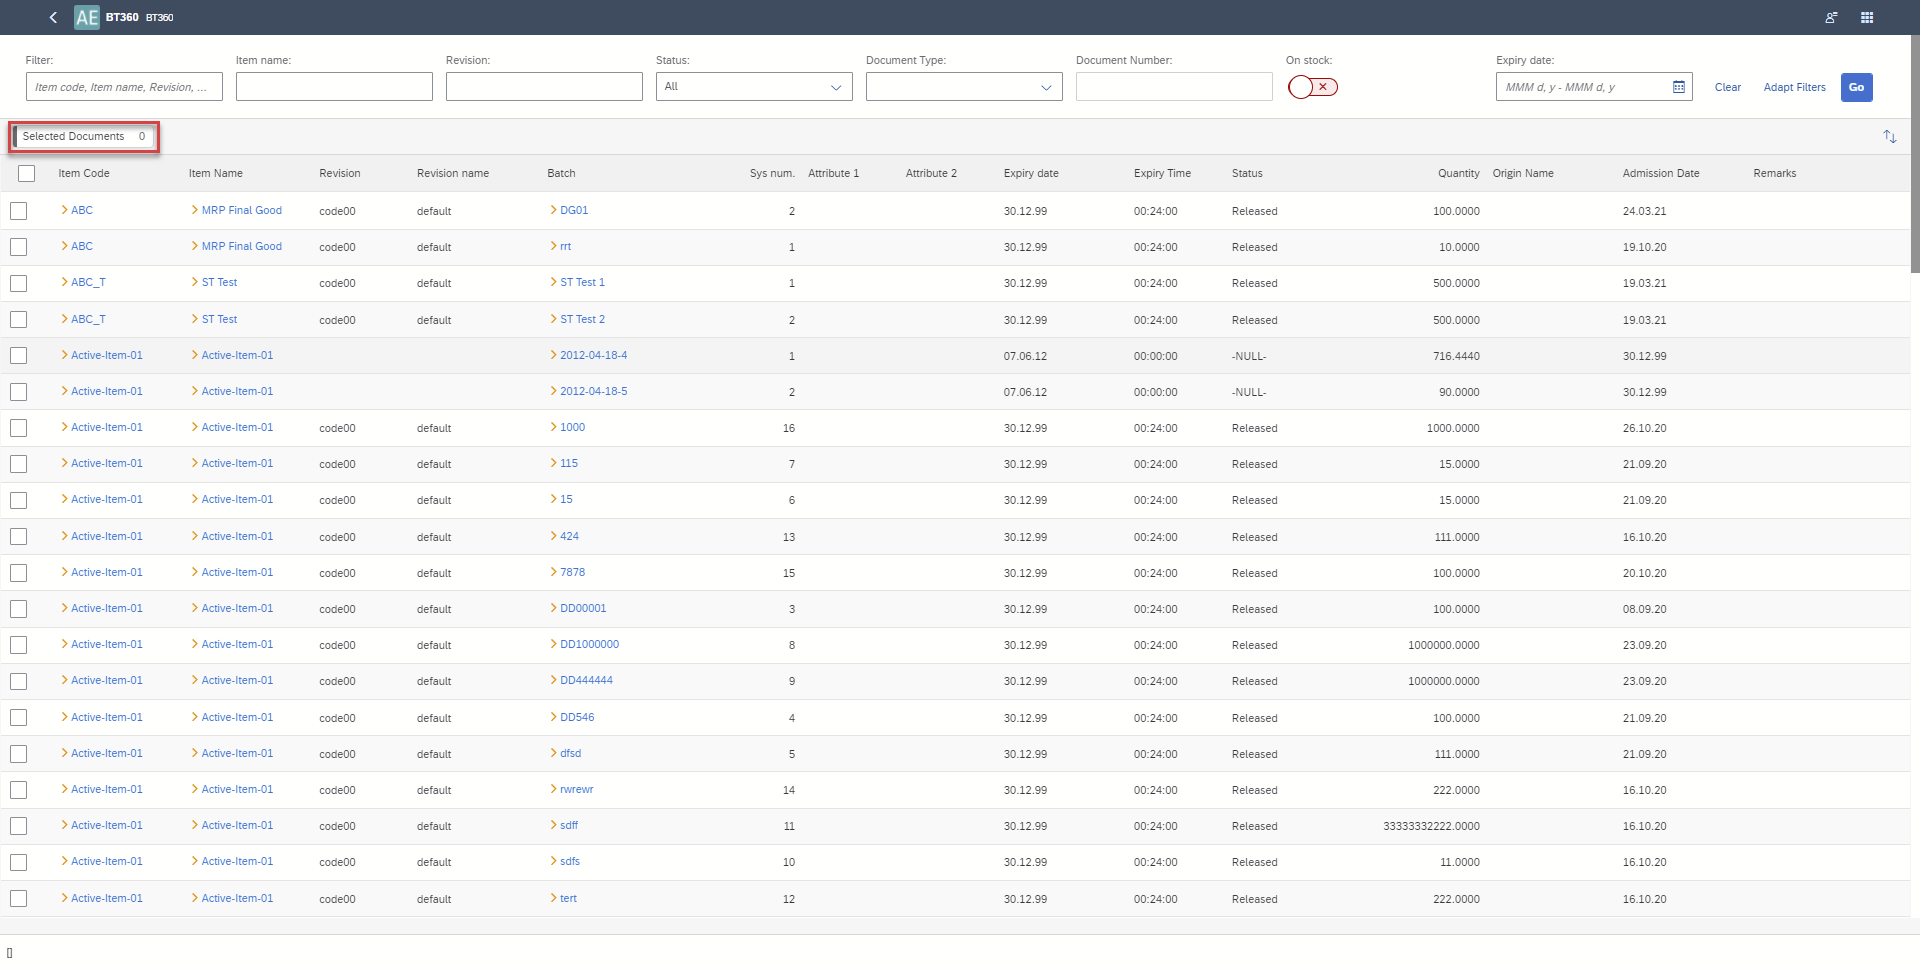
Batches selection for Trace Analysis
You can select many Batches directly from the list of Batches or you can first select documents and this way narrow down Batches to these related to the selected documents.
To narrow down Batches please select the button Select Documents
Batch selection and run of Trace Analysis
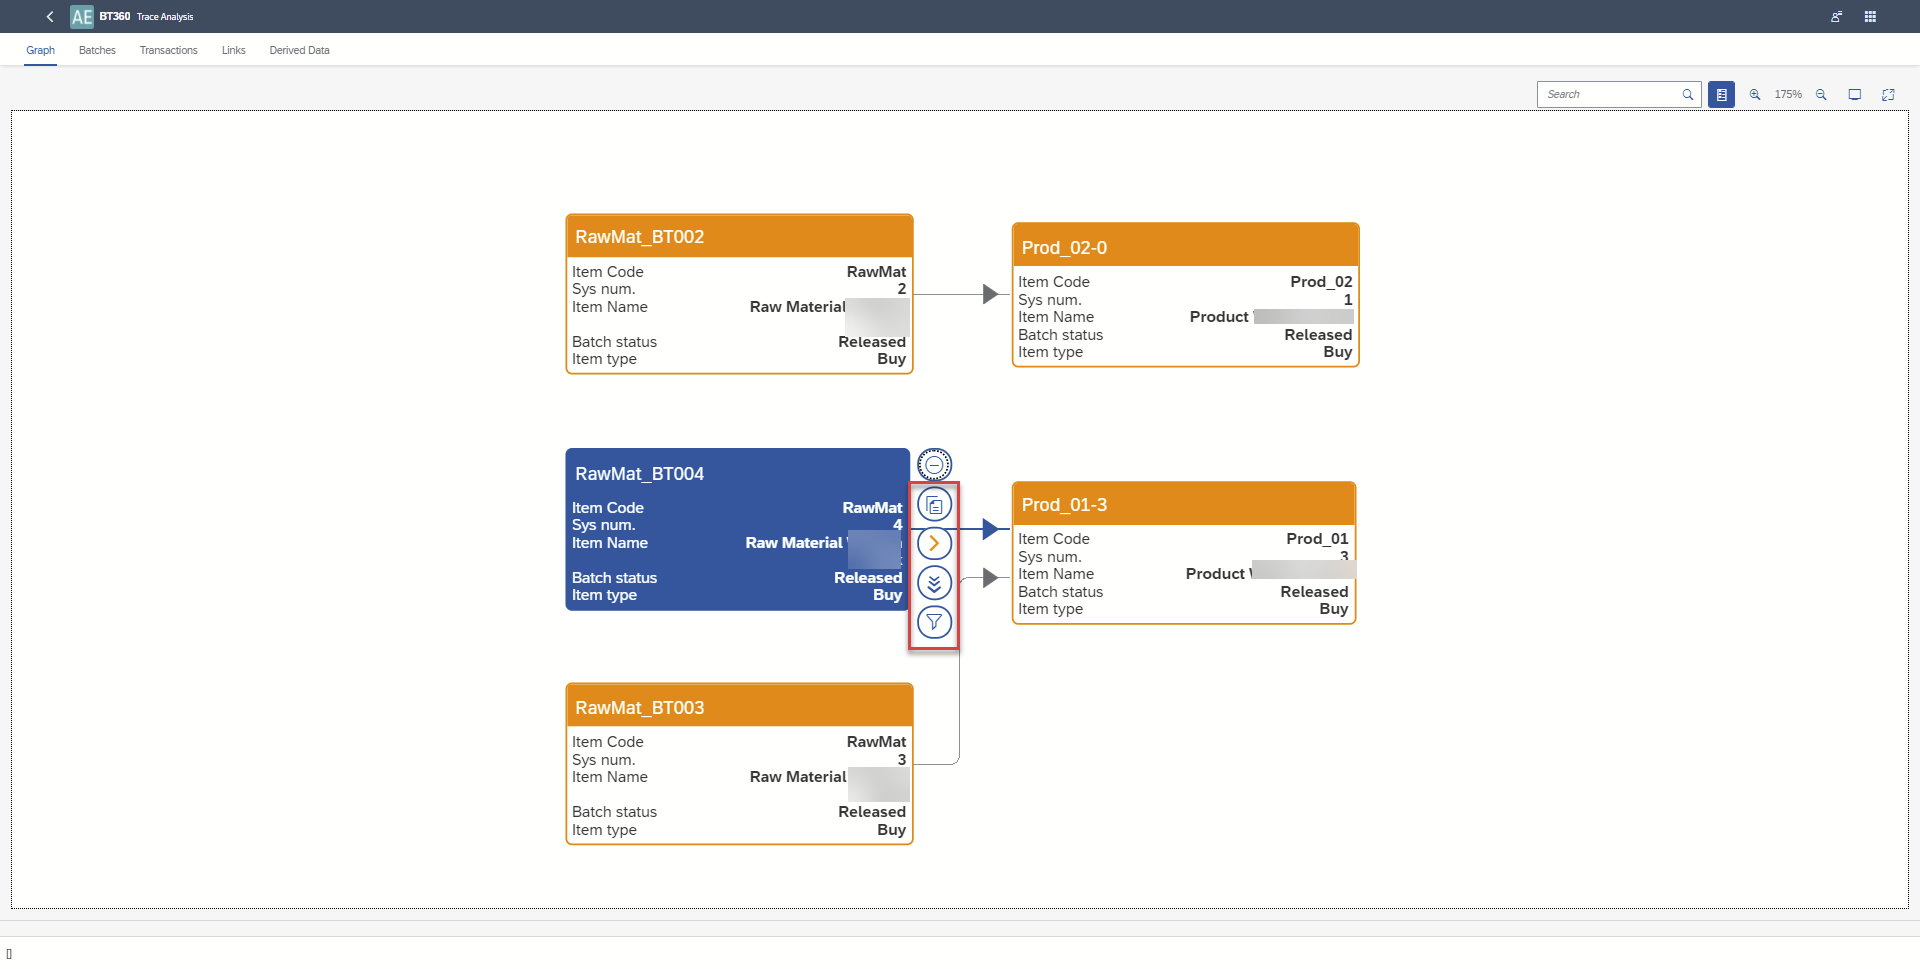
Trace Analysis
Graph
On a graph, you can:
- Show related documents
- Open related Batch Details in SAP Business One - yellow arrow (BT360 have to be opened from the SAP Business One level)
- Go to a single Batch analysis (is opened in a new tab of the browser)
- view only related nodes.
Export data
In each grid (Batches, Transactions, Links, Derived Data) you can sort data. All grids are exported to the same file. Each kind of data is exported to a separate sheet.